


The on-chain analytics firm Glassnode has revealed how Solana has recently shown more resilience than Bitcoin and Ethereum in this indicator.
Solana Has Seen A Smaller Decline In Hot Capital Than Bitcoin & Ethereum
In a new post on X, Glassnode discusses how the various top coins in the cryptocurrency sector have performed in terms of Hot Capital during the recent market downturn.
The “Hot Capital” here refers to an on-chain metric that tracks the recent capital flows for a given asset. The indicator combines the Realized Cap of two coin age ranges, 24 hours and 1 day to 1 week, in order to calculate its value.
The Realized Cap is an on-chain capitalization model that assumes the ‘true’ value of any token in circulation is equal to the spot price at which it was last transacted on the blockchain.

This indicator basically represents the total amount of capital that the investors on the network as a whole have used to purchase their coins (which is in contrast to the usual market cap, signifying the value the holders are carrying in the present).
As such, the Realized Cap of the youngest age bands (24 hours and 1 day to 1 week) tells us about the amount of capital that recently flowed into the cryptocurrency.
Now, here is a chart that shows the trend in the Hot Capital for Ethereum over the last year:
Looks like the value of the metric has gone down in recent weeks | Source: Glassnode on X
As displayed in the above graph, the Hot Capital (black curve) spiked to a high level for Ethereum back in December, implying a high amount of fresh capital was flowing into the asset. Since then, however, the metric has plunged.
Compared to the December peak, new ETH demand has dropped by over 52%. Bitcoin has also witnessed a similar pattern, with the number one cryptocurrency even seeing a larger drop of 77%. “Momentum has cooled sharply since December peaks,” notes Glassnode.
Interestingly, while the top two coins have seen this significant cooldown, Solana has shown a different trend, as the below chart shows.
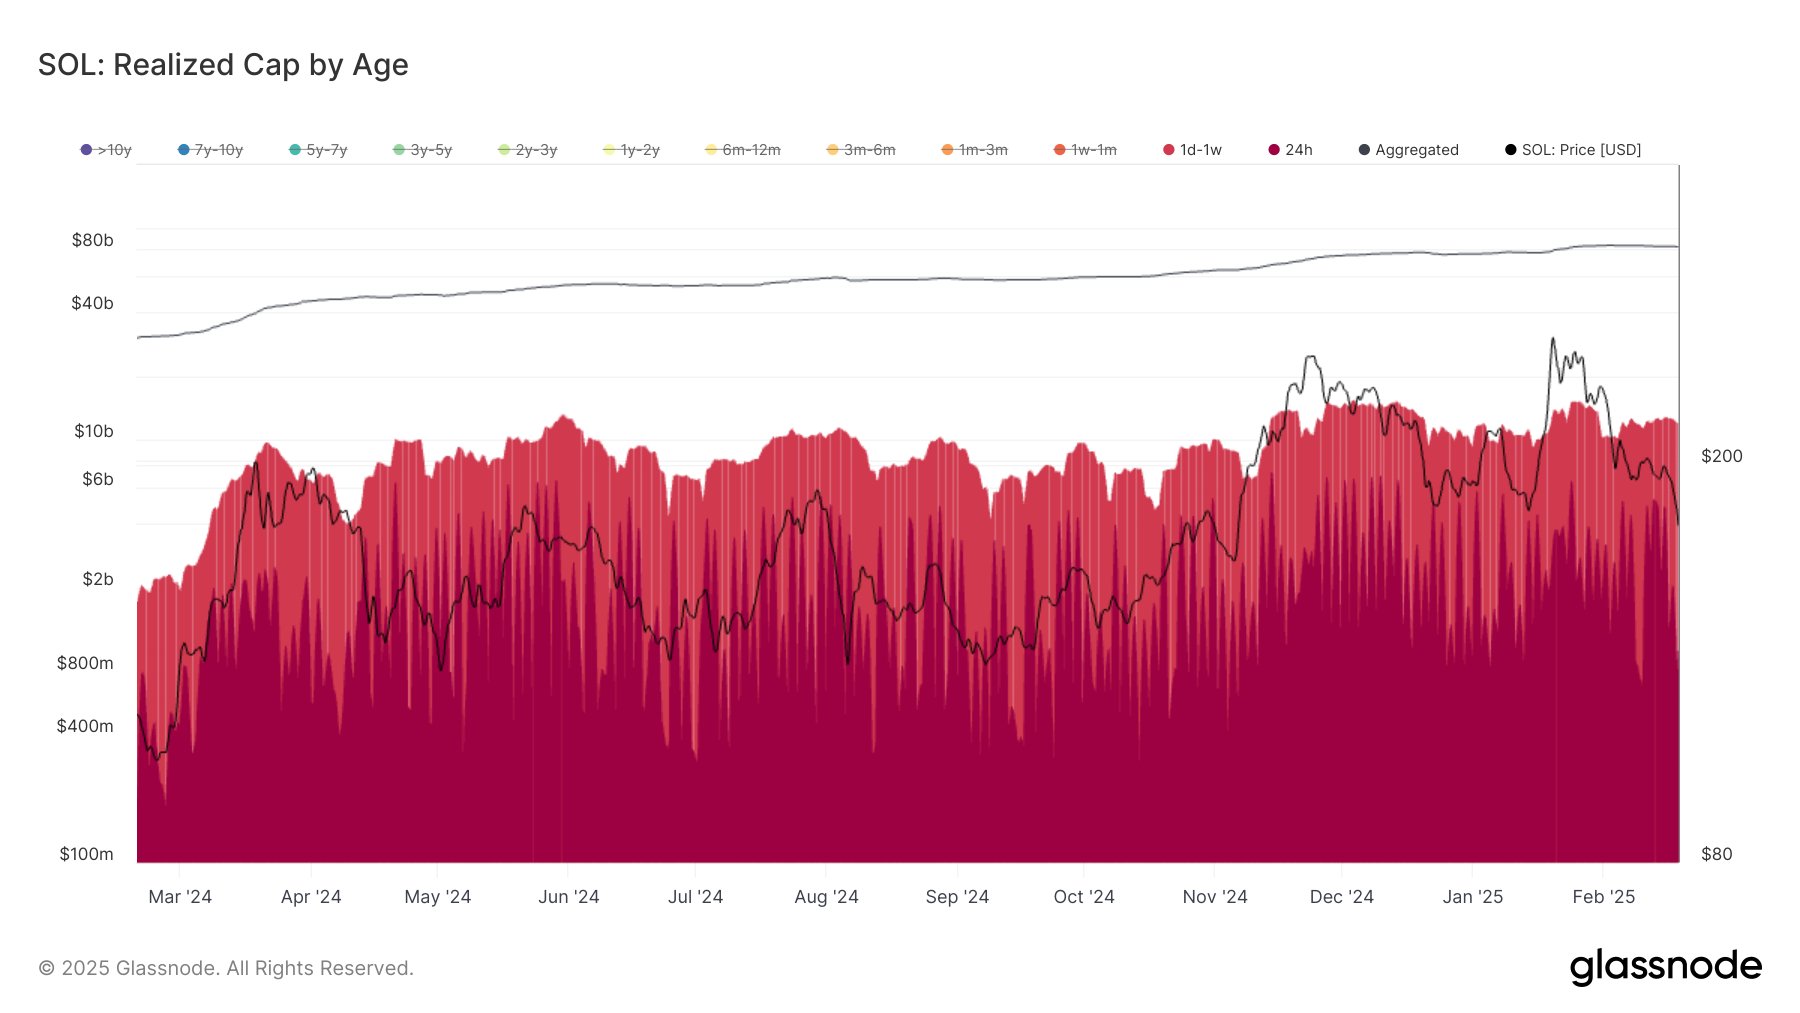
The trend in the SOL Hot Capital during the past twelve months | Source: Glassnode on X
In December, Solana’s aggregated Realized Cap of the 24-hour and 1-day to 1-week age bands stood at $15.8 billion. Demand has cooled for the coin as well since then, but with the metric today sitting at around $11.8 billion, the difference is of just 25%. Clearly, SOL has shown more resilience than BTC and ETH during this period.
It now remains to be seen whether this would end up reflected in Solana’s price or not.
SOL Price
At the time of writing, Solana is trading around $172, down more than 12% over the last week.
The price of the coin seems to have plunged over the last few days | Source: SOLUSDT on TradingView
Featured image from Dall-E, Glassnode.com, chart from TradingView.com

Be the first to comment